Susan Olson, an aerospace engineer with a deep interest in the river industry, offers mariners a new tool for better understanding the trends and data relevant to the maritime world. BargeAI, an application from Olson’s company, ActionIntel, delivers a diverse amount of data directly into the hands of the user with a navigable interface and dozens of interactive graphs.

Growing up alongside the Ohio River and a resident of Kentucky, Olson has always been familiar with the water. Her time researching at the Office of Naval Research at Notre Dame, her experience with AIS data and VesselTracker while working with Genscape and her time as CEO of Demeter Logistics all helped equip Olson to apply analytics and machine learning to the inland waterways.
“I kept hearing about information gaps on the river system,” Olson said. “The passion in me wanted to solve that problem for them, and I felt like my talents with data would be put to good use.”
With a drive to help the maritime industry and a love of analytics, Olson spent a year building what is now known as BargeAI, an analytics application that provides customers with a wealth of information regarding towing efficiency, commerce trends, transit times, barge freight costs and more. BargeAI pulls data from dozens of sources to bring relevant and useful information to users in a clear and comprehensive way. No confidential analytics is displayed, only information permitted for use by BargeAI’s sources. The application is easy to navigate, allowing users to toggle through regions, commodities, companies and even horsepower to display the data most accurate to individual needs.
“All organizations are challenged to harness enough technology resources to produce business intelligence from their data, not to mention third-party data,” Olson said. “With limited budgets and an already strained IT team, other needs take priority. That’s where we come in. We put the data to work for people.”
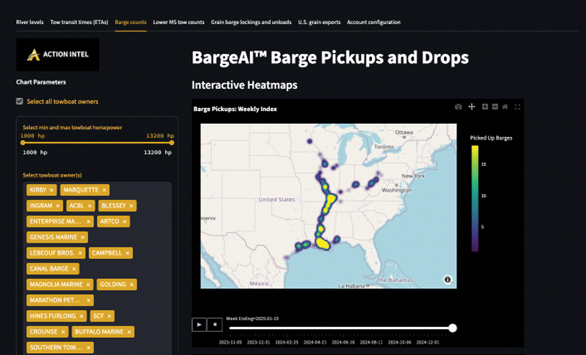
Diverse and colorful graphics are a trademark of BargeAI. Numbers are not displayed in rows and columns for users to decipher. Instead, they are depicted visually in the form of heatmaps, line graphs and other dynamic presentations. The interface is designed to allow users to better understand exported product amounts and travel times, allowing for efficient trend analysis and planning. Olson cited Kris Kimel, the co-founder of Space Tango who is responsible for experiments on the International Space Station, on why visual data such as heat maps are so important.

“He said that he stopped using words altogether in presentations,” Olson said. “He only uses pictures. That sums up why we use heat maps and visuals whenever we can. People can get so much information quickly from a visual like a heat map. It’s attractive and informative.”
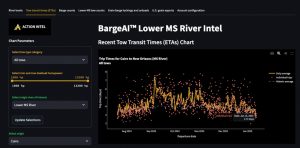
BargeAI has multiple uses for barge lines and other maritime companies. The application draws on data from 2006 to the present day, with some data updates occurring every hour or as often as every 10 minutes. The Recent Tow Transit Times (ETAs) Chart shows presents historic average, daily average and individual trips from one destination to another. Users can choose origin and destination points from dropdown menus, as well as select tow type, horsepower and origin river. The accompanying graph displays when the selected trip was taken, by whom, with what tow type, and how long the journey lasted. Such information can be helpful in planning, Olson said.
BargeAI uses reports from AIS (Automatic Identification System data, or vessel traffic data) to accurately capture the length and width of a tow, and, with the help of machine learning, algorithms can decipher the expected size and number of barges based on a square tow. The counts are benchmarked using the U.S. Army Corps of Engineers’ Lock Performance Monitoring System, as well as other available data.
“We’re excited to provide our customers with the exclusive source of industry-wide barge-in-tow quantities on the inland waterways,” Olson said.

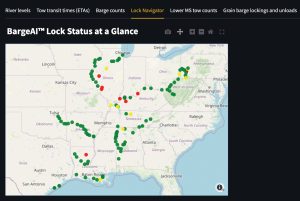
The LockNavigator feature was made available to use in BargeAI in January. The feature is an interactive visual map that provides lock status and performance across multiple river systems. Users can easily learn delay and arrival information, as well as daily tonnage data.
With the help of Creed Grann, ActionIntel’s head of operations and sales, the company is also beginning work to install live-feed cameras on the river system. The first camera will be installed this quarter near the I-10 bridge in Baton Rouge and will monitor barge traffic 24/7.
“People will get exclusive access to information like empty versus loaded barges, covered versus uncovered barges, [kilobarrels] of liquid barges and much more” Olson said. “We’ll also work to extract commodity flows, combining the imagery with the other data analytics we produce.”
ActionIntel is continuing to work on other projects outside of BargeAI. TradeAI will provide customers with market intelligence on river commodity flows, U.S. imports and exports volumes, while also focusing on different commodity areas such as grain products, chemicals, crude and more.
“With changing tariffs and renewable fuel policies, the trade landscape could become even more dynamic and volatile,” Olson said. “We want to empower people to stay ahead of the curve with critical information for trade and infrastructure decisions.”
At the request of the commercial customers of ActionIntel, TowTracker is also under development. That application will give customers instant positioning and analysis of specified tows, allowing products to be tracked without hassle.
“We’re planning for this product to be the place where customers can see imagery alongside the tow positions,” Olson said. “We’re so excited about people being able to see the product in motion.”
ActionIntel offers a two-week trial period, along with a 30-minute demonstration. Customers will receive the analytics that come with BargeAI and downloadable graphs, as well as a Daily Digest email. The Daily Digest email is free to those who decide not to subscribe.
“A lot of inland transportation companies are required to report data to government organizations every day,” Olson said. “AIS systems report out for safety. What I believe is frustrating to people is that they want to be able to access this same data for decision making, but it is all over the place. What we do is bring that data together in one place to help solve that frustration. We also clean, curate and analyze the data to make it ready for use in decision-making. We like to say that data is for everyone. We want everyone to be empowered with the data that’s out there, including the data that they contribute through different government reporting systems.”
————
Featured photo caption: BargeAI heatmap depicting barge pickups and drops.


