It happens every year like clockwork. Autumn follows summer, water levels on the Mississippi River and its tributaries fall, and barge freight rates rise as grain and soybean movements pick up.
Of late, though, water levels aren’t just dropping each autumn. Instead, seemingly every year they are setting or flirting with new record lows at various locations of the river system. This year is no different.
Hurricane Helene
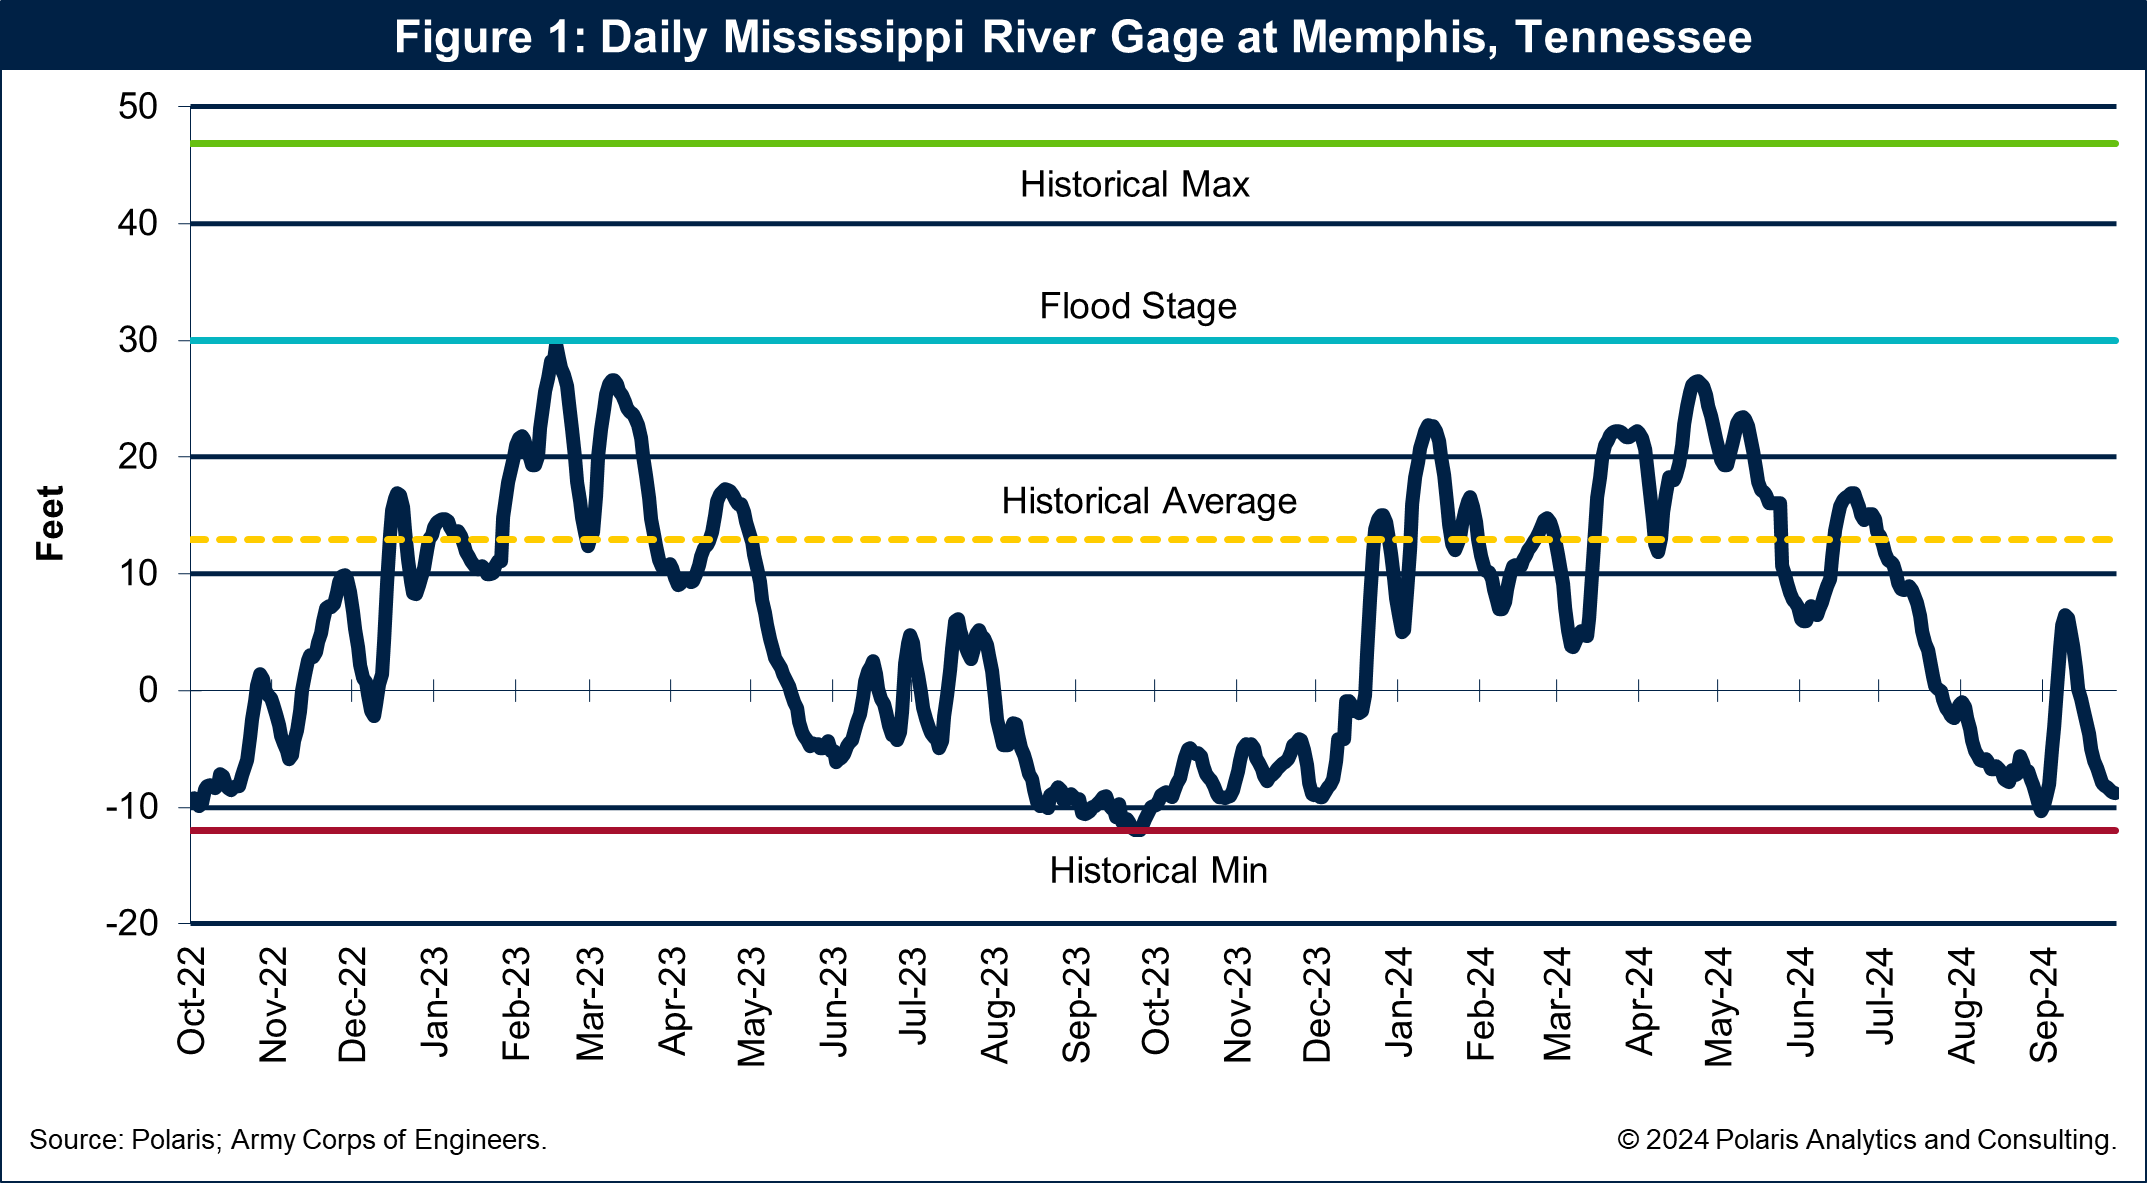
While Hurricane Helene left devastation in its wake, the storm did provide relief to the navigable waterways of the lower Ohio and Mississippi rivers. Water levels in the Mississippi River at Memphis, Tenn., for example, improved considerably. However, as fast as the water levels rose, they also fell. On September 24, the river gage reading at Memphis was -10.3 feet. It rose to 6.5 feet on October 3 and had fallen back to -8.7 feet as of October 23.
Hurricane Helene made landfall on September 26 near Perry, Fla., and its path went over the panhandle of Florida, through western Georgia and North Carolina and eastern Tennessee. Along that path, rain from Helene refilled the Tennessee and Ohio rivers and their tributaries. The water from those river systems made its way downstream into the Lower Mississippi River.
The water levels of the river system rise and fall throughout the year and in a seasonal pattern. The concern is that levels have reached historically low levels for three consecutive years. Nearly one year ago, the river gage at Memphis reached a record low of -12.0 feet, surpassing the record set in 2022. Could we see a new record at the Memphis gage for a third consecutive year? Only time will tell, but if current conditions are a sign and rain is absent from the forecast, a new record low will be within reach.
Water levels in the Mississippi River at Memphis, including the historic low, high and average, and flood stage levels are shown in Figure 1.
Barge Freight Rates Taken In Stride
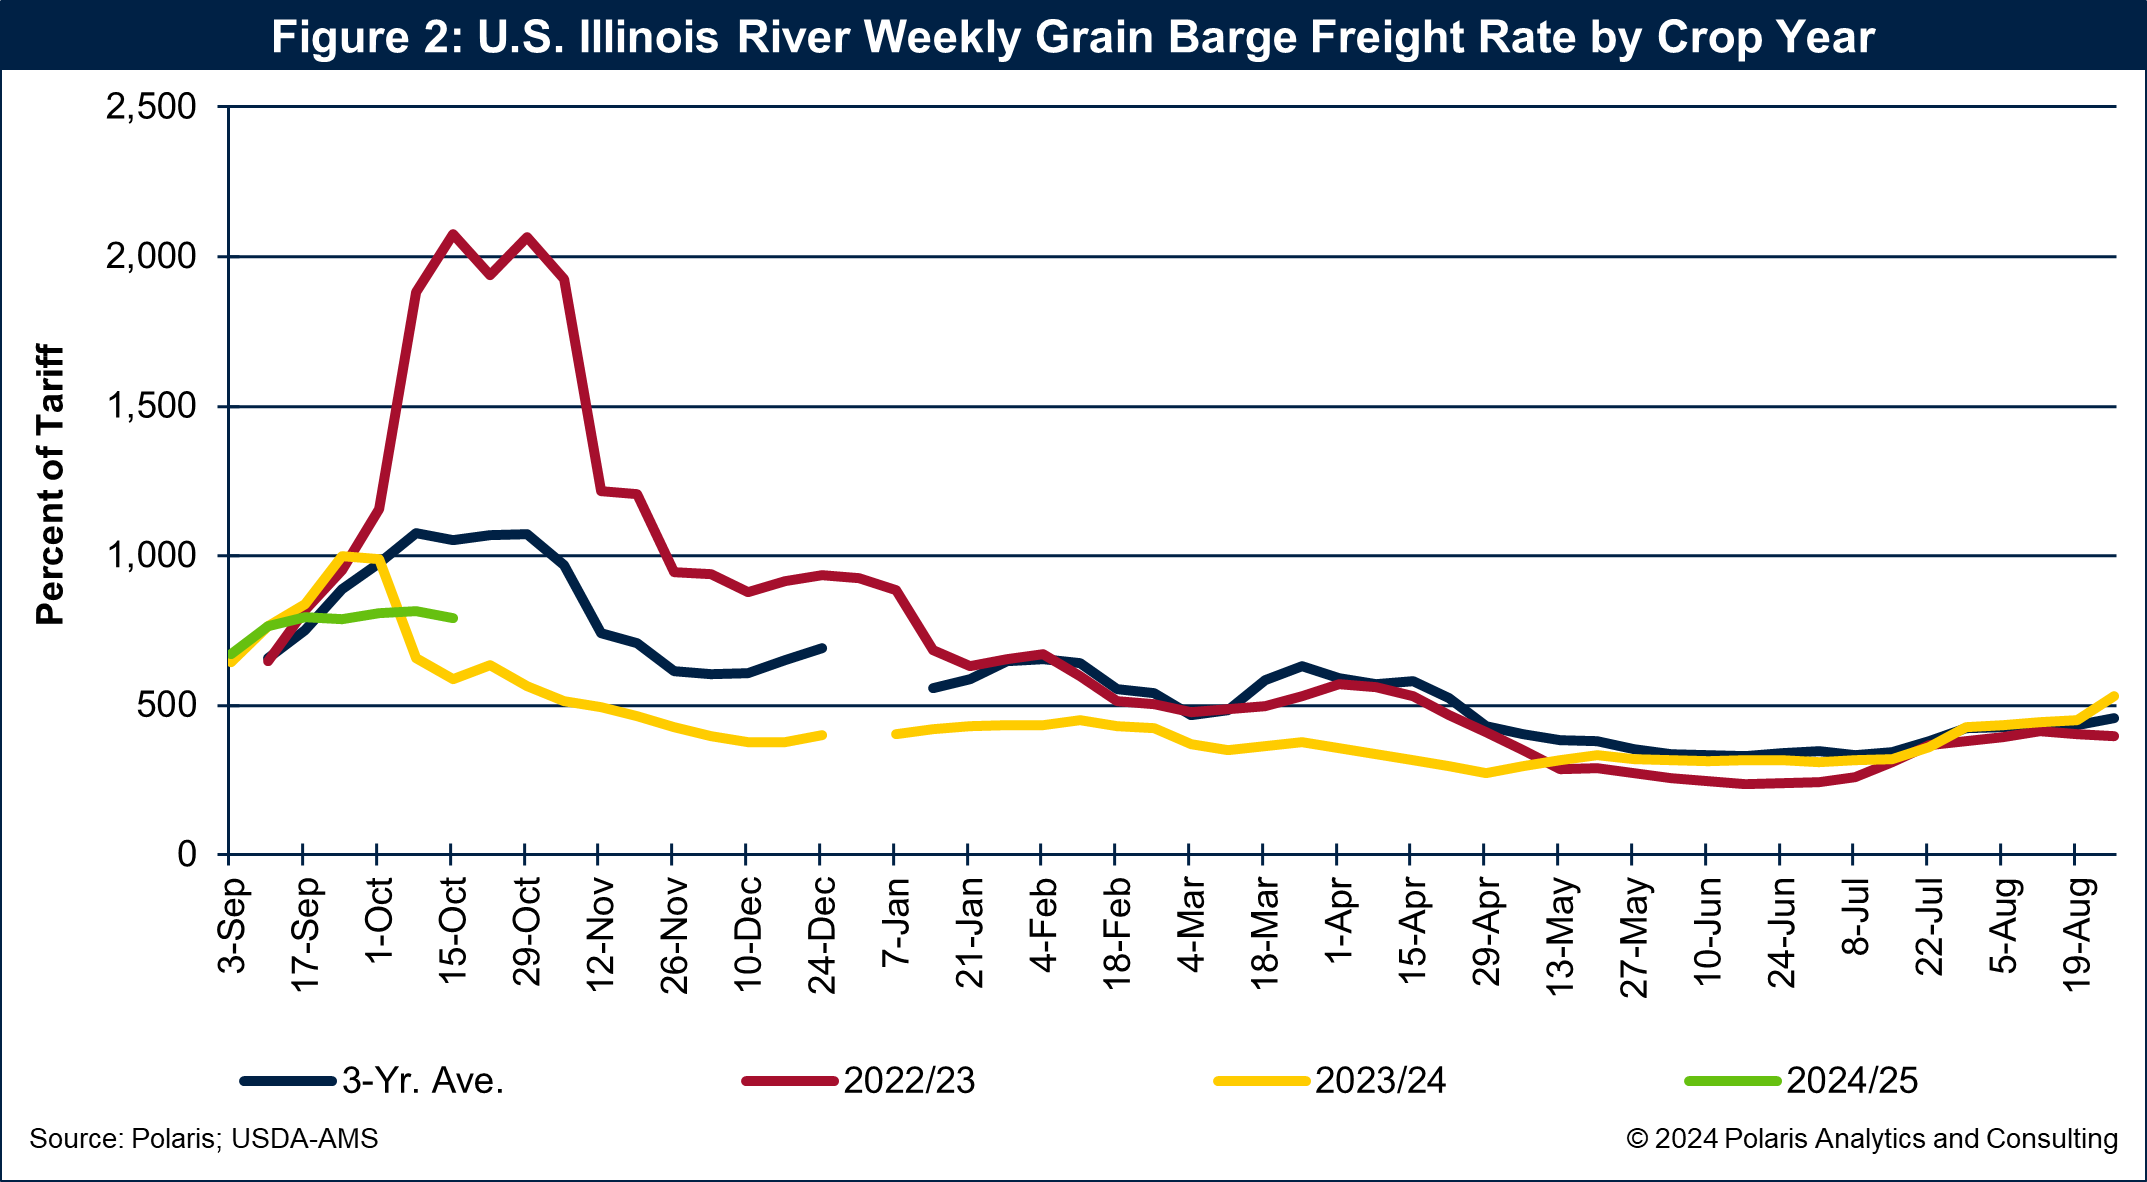
Barge freight rates have been flat since early September at about 800 percent of tariff off the Illinois River. This rate level is well below the three-year average of about 1,100 percent of tariff, while above last year’s 590 percent of tariff.
The rates are taking the low water conditions in stride, however. The industry learned from the previous two years of low water and is using that knowledge to keep river traffic flowing. At this year’s Inland Marine Expo (IMX) in Nashville, Tenn., hosted by The Waterways Journal, speakers on the “Low Water Lessons Learned” panel emphasized keeping communication channels open, being out front with the communications and communicating early.
That communication is between and among barge operators, members of the U.S. Army Corps of Engineers and the U.S. Coast Guard, and other industry participants. That means meeting in person and then keeping lines of communication open and acting on the items discussed. Such strident efforts have served the industry well, supporting shippers and the U.S. economy.
In the meantime, the fleet of barges plying the inland waterways has not expanded as shown in The Waterways Journal’s Inland River Record Barge Fleet Profile report and is not expected to increase in any meaningful fashion. If barge draft or tow restrictions are applied, then the barge market will see barge utilization levels surge and barge rates rise.
The Corps strives to maintain a 9-foot navigation channel along the Mississippi River and Tributaries system (MR&T). On certain stretches of the MR&T, especially downriver from the last lock on a river system, such as the Chain of Rocks Lock or Lock 27 near St. Louis, barges can and are loaded to deeper drafts. On the Lower Mississippi, it is not uncommon for barges to be loaded to drafts from 10 feet to 13 feet.
As an example of higher utilization levels, consider that each 6 inches of draft is equivalent to loading about 106 shorts tons of cargo. If barge loaders on a deeper draft river segment normally load barges to an 11.5-foot draft (the average of 10 feet and 13 feet), and there are 35 barges in the tow, they are loading those barges with 70,735 short tons of cargo, the equivalent of 2.5 million bushels of corn.
If the draft is limited to the 9-foot channel the Corps maintains, that means the barge loader fills each barge with 537 fewer tons, or 36 percent less cargo. Spreading the impact of that draft restriction over 35 barges means there are 18,795 fewer tons loaded on that tow. To transport the full volume, the shipper would need to employ 13 additional barges to move the same volume of commodities as when there was no draft restriction. Finding those 13 additional barges comes with a cost reflected in higher freight rates. And this says nothing about smaller tow sizes.
In the meantime, and unless water levels dramatically fall while demand stays strong, barge freight rates are at seasonal highs and have an inverse (or are much softer) starting November.
The barge freight rate off the Illinois River is shown in Figure 2.
Corn Basis Values Rising
In the meantime, the November elections may be pushing commodity volumes such as grains and soybeans into the export pipeline out of fear of another trade war with China, and that global demand for U.S. corn is attractive.
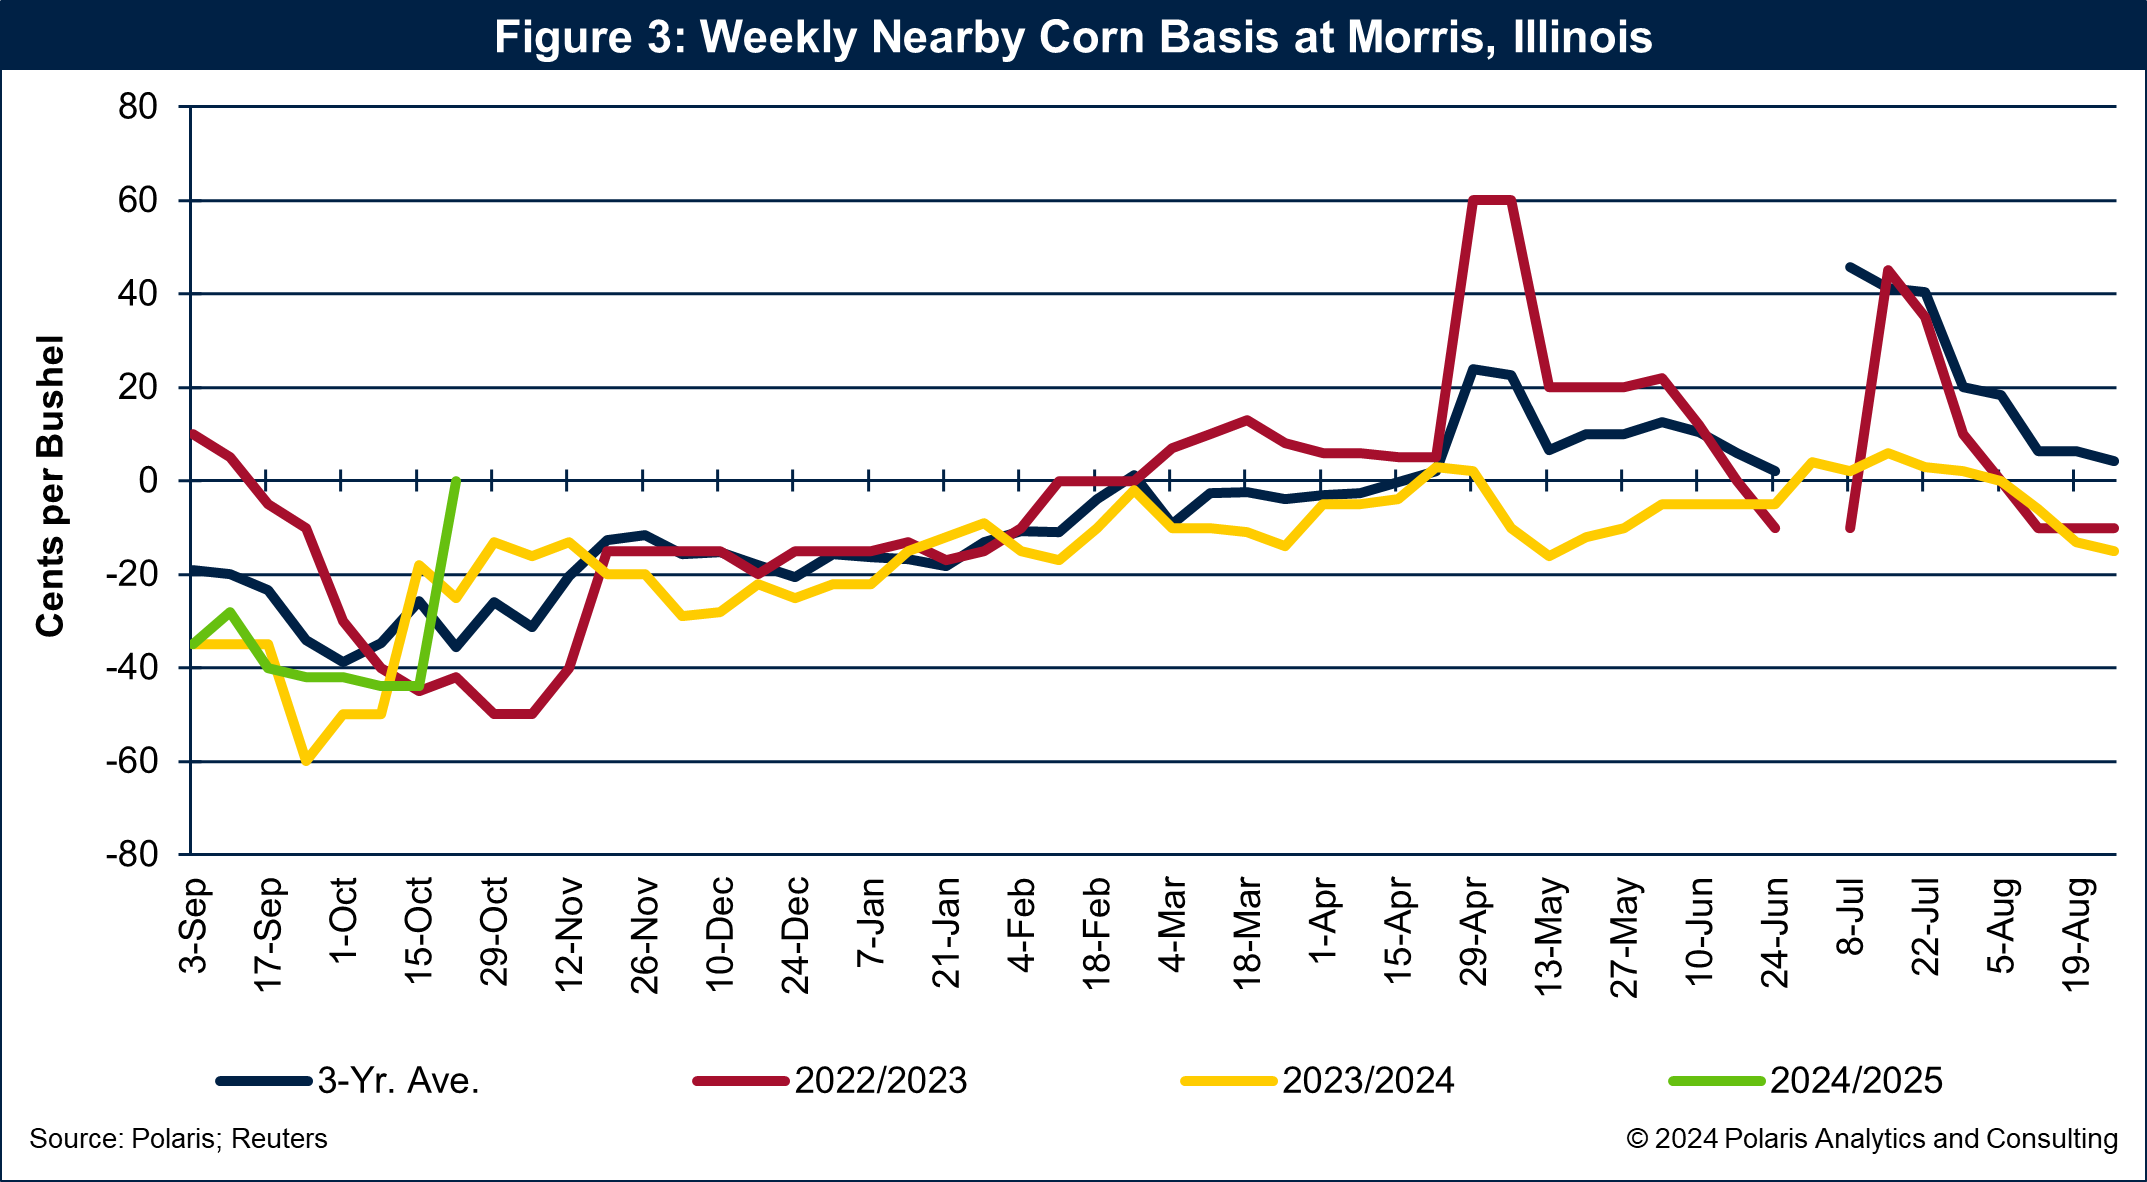
As an example, corn basis values (the difference between the Chicago futures price and the local river cash price for corn) along the MR&T are firming, working to attract corn volumes to the market. However, as soybean harvest marches past its peak, the export channels are filling up with soybeans. To find a spot in the export pipeline, corn must buy its way into those channels. Having a simultaneously strong soybean and corn export program will challenge the export supply chain.
As an example of firming corn basis, the weekly nearby corn basis values at Morris, Ill., are shown in Figure 3.
Grain Barge Lockages
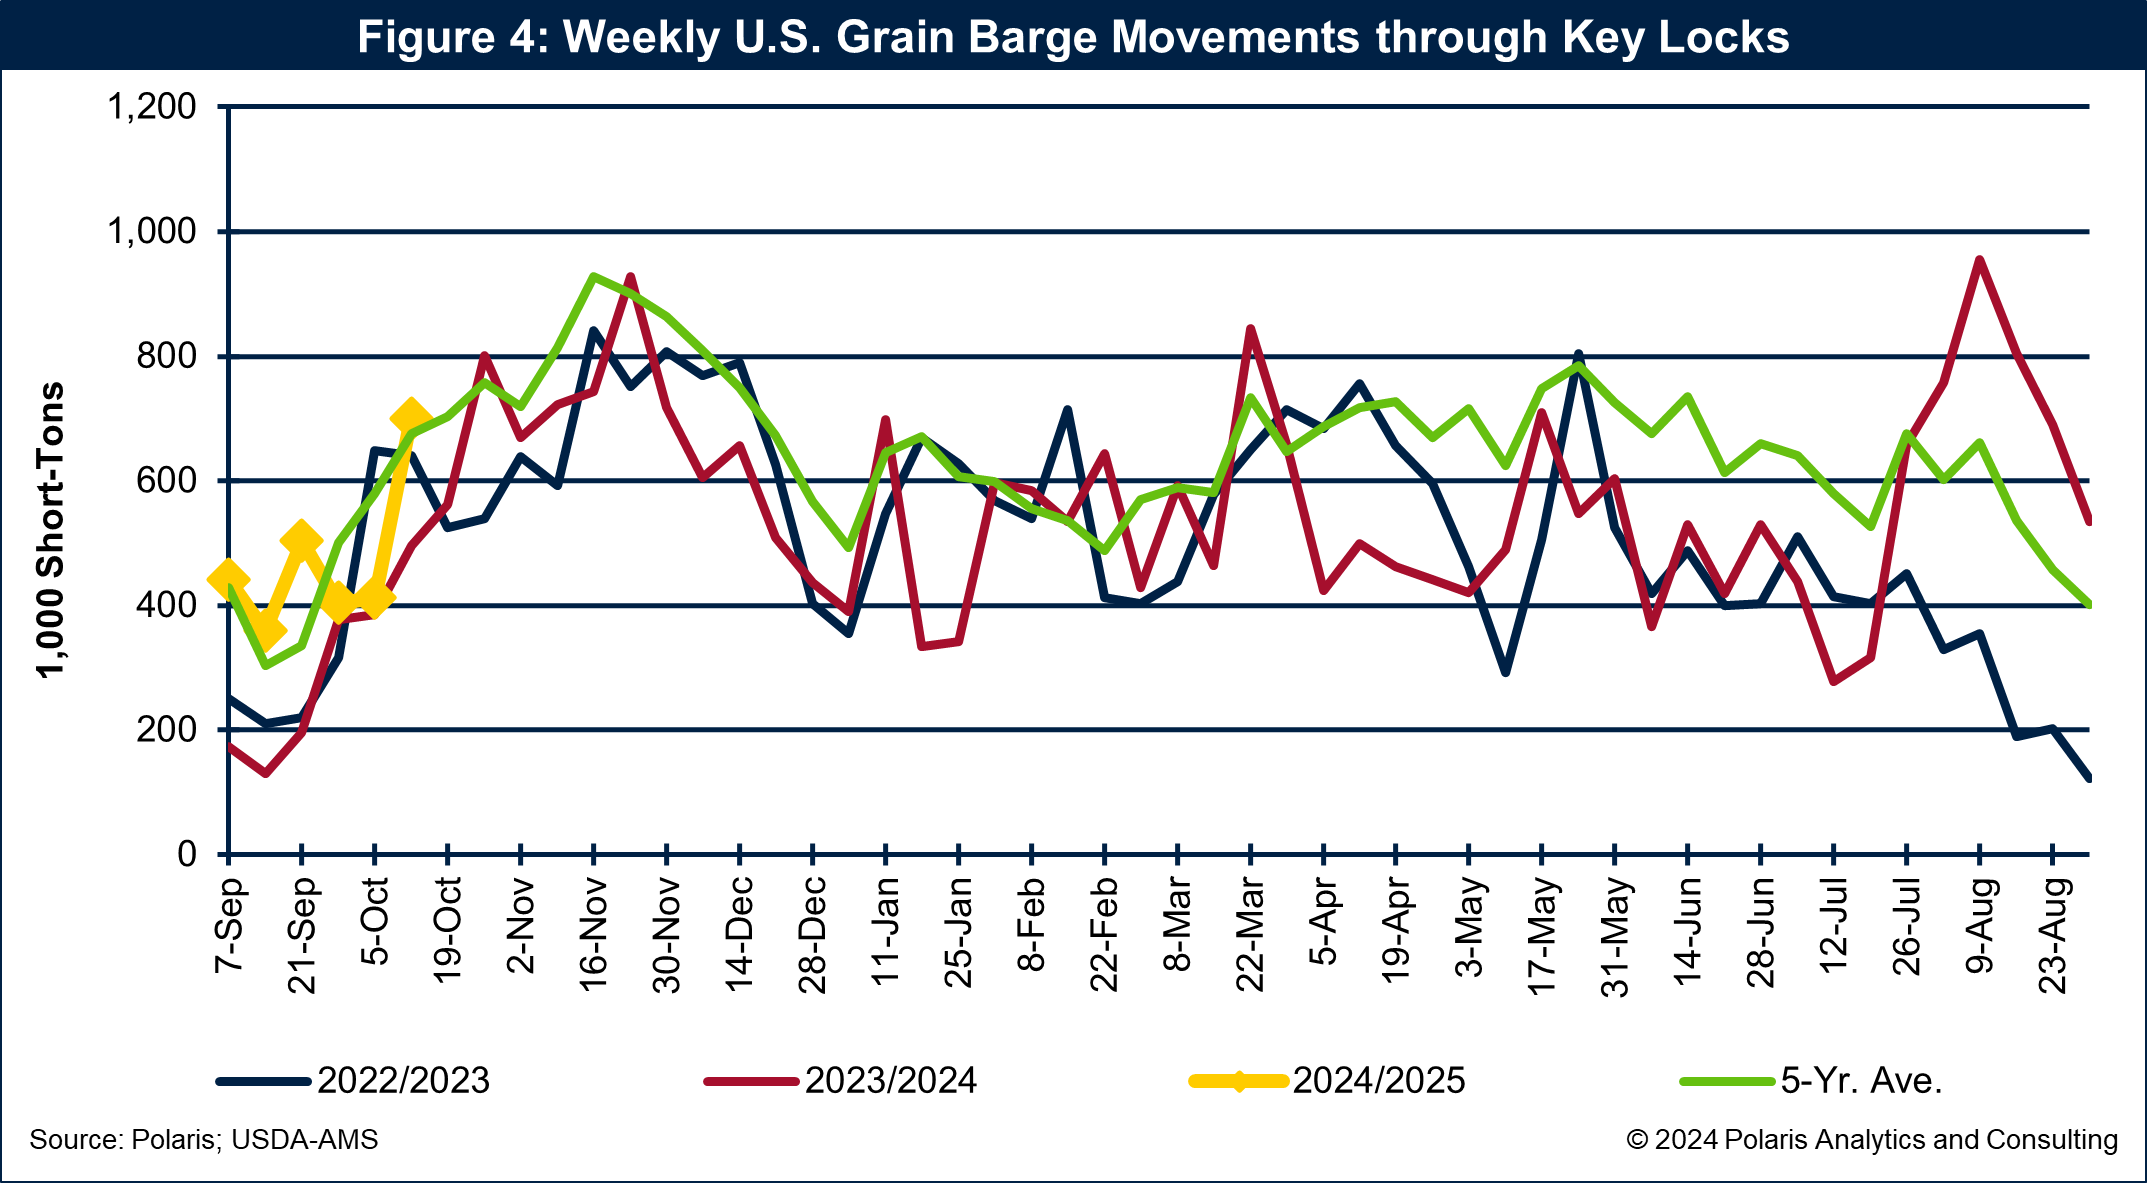
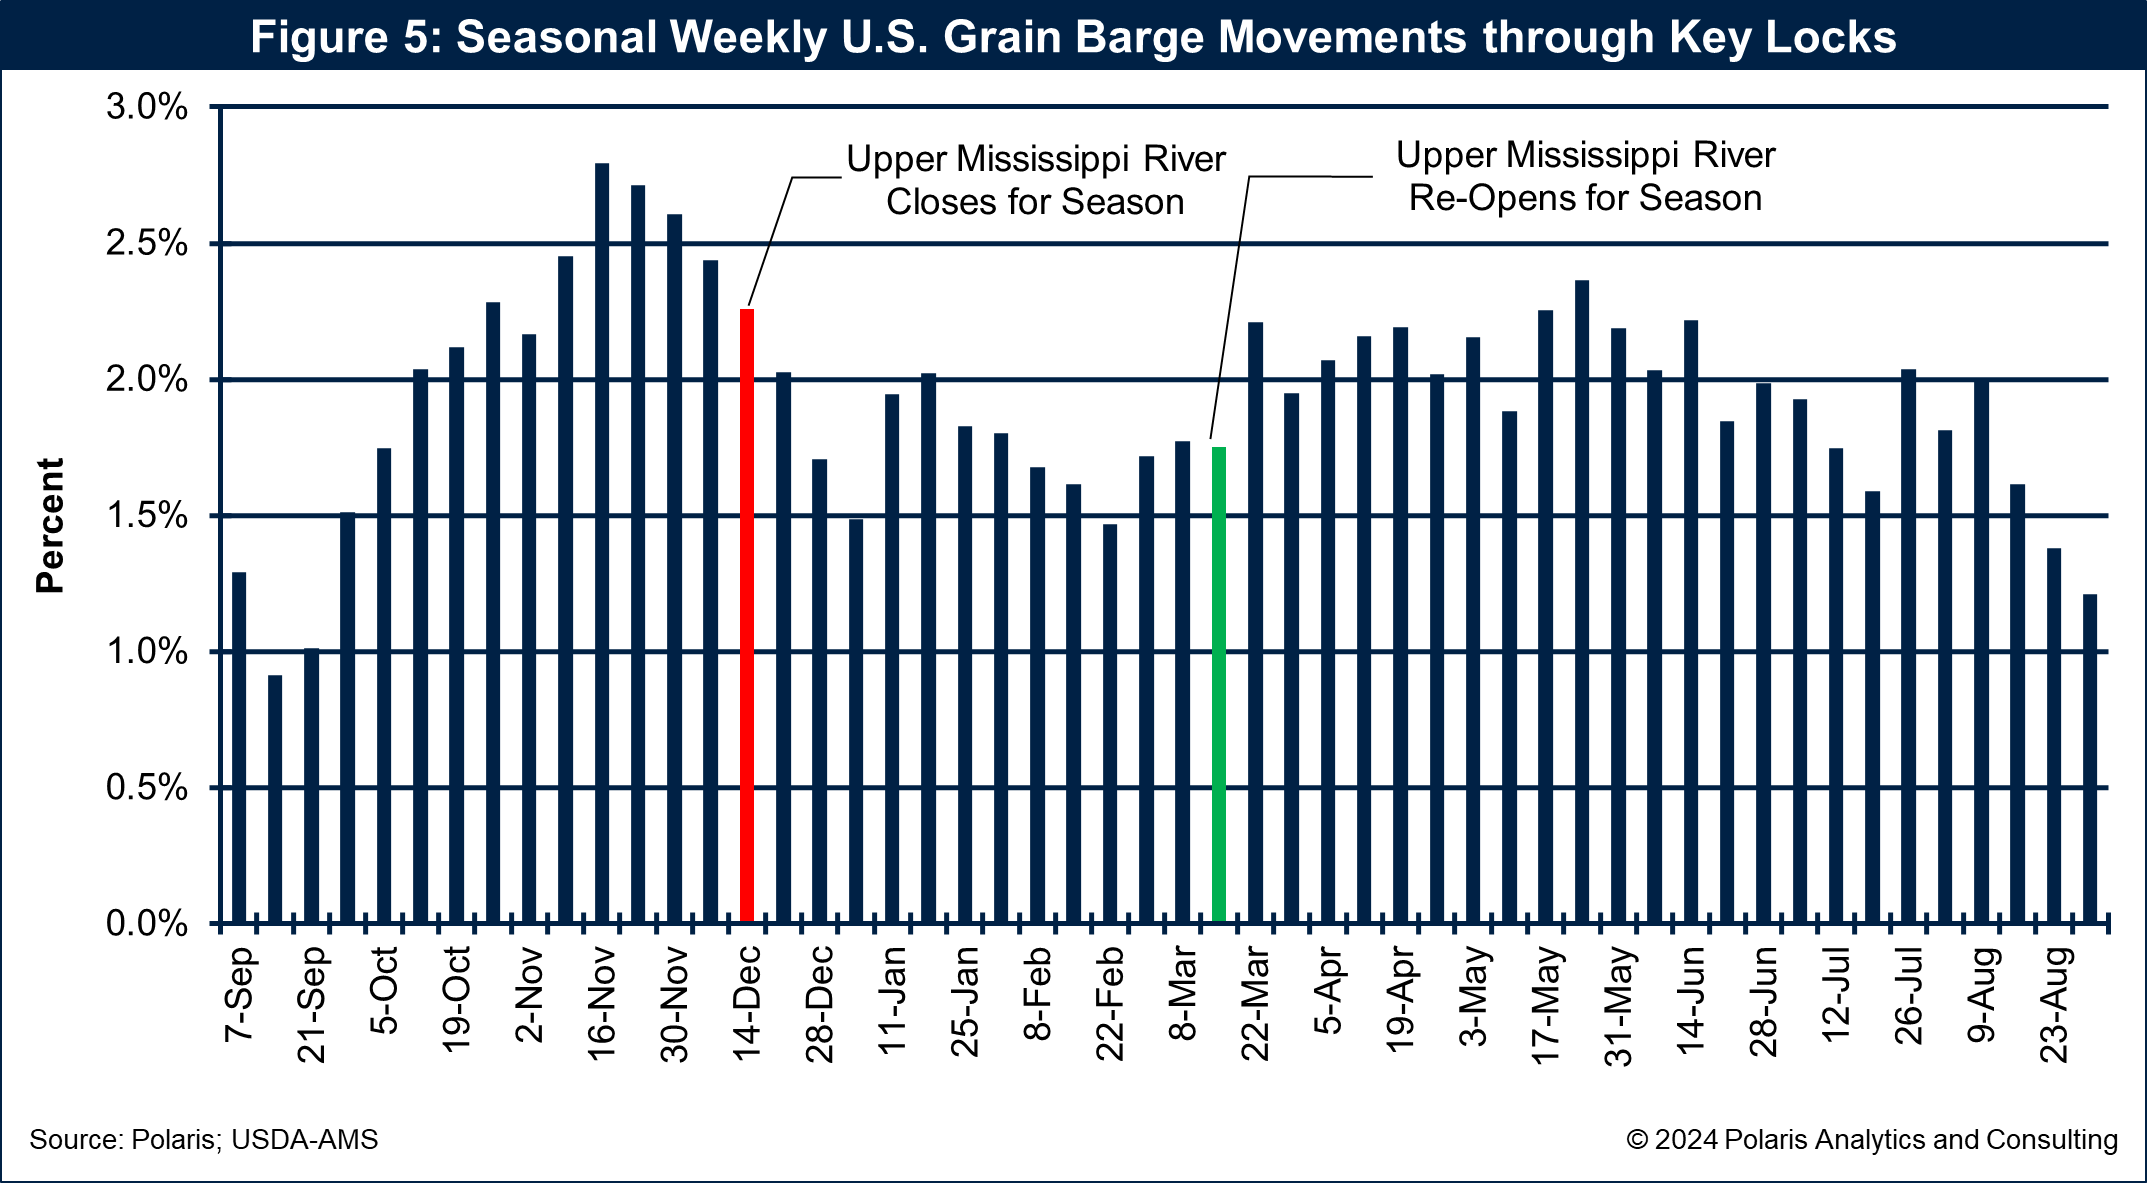
Barge loads of grain and soybeans have been ramping up since the first of October as corn and soybean harvests surpass 50 percent. It was reported this past week that the corn harvest has surpassed the midway point, while soybeans achieved that two weeks ago. Barge locking volume through the key locks typically peaks during mid-November, four weeks from now.
With the soybean harvest the first crop to hit the halfway mark, soybeans are the first to move in large volumes by barge down the river system. Their movement supports the export program through the grain elevators along the Lower Mississippi River. Soybean barge volumes and exports peak in mid- to late-November.
Corn volumes flowing to the river typically follow the soybean program and peak later in the crop marketing year. One important reason for this is that Brazil is not sending soybeans to the market, which leaves the United States as the key soybean supplier. Once the new calendar year arrives, Brazil will enter the export market, crowding out U.S. soybeans and making way for U.S. corn exports.
Weekly U.S. grain barge movements through the key locks are shown in Figure 4, and the weekly seasonal lockings are shown in Figure 5.
Without another rain event on the horizon, water levels will be a concern for navigation. Helene’s outflow and open lines of communication among waterway stakeholders are key factors keeping commodities flowing and barge freight rates in check.
