By Ken Eriksen

Billy Joel’s song “Pressure” jumped into the top 20 in 1982. He wrote the song to tell of the “pressure of creating and the pressure of being a provider.” While he did not mention the barge market or inland waterways, he might as well have been speaking of them, then and now!
“Pressure!”
The pressure on the inland barge industry comes in various forms, and the barge providers know it all too well. One analytic tool to understand those forces is the barge pressure indices.
Inland River Pressure Indices
The inland river barge market of the Mississippi River, its connecting waterways and tributaries join the vast reaches of the United States from Pittsburgh to Chicago; Minneapolis and St. Paul, Minn., to St. Louis; Memphis, Tenn., to New Orleans, Houston and points elsewhere, and the world. The system is unique and expansive, handling about 500 million short tons of cargo each year, some years less and some years more. And doing so is a full contact sport by enduring low and high water, hurricanes, infrastructure challenges and failures, and changes in policies that impact commodity movements or affect the equipment being operated.
The Waterways Journal published its first Inland River Record Commodities report in early July. The report is a fundamental view of the inland river barge fleet (see WJ’s Inland River Record Barge report that includes a profile of the barges by type operating on the inland rivers) with the associated commodities moved by barge type. A description and summary of the IRRC was published in WJ on July 3 (Barge Fleet Cargo Is Diverse).
This column digs further into the IRRC report to look at barge pressure indices. Quite simply, pressure indices are an attempt to relate the supply of barge equipment to the demand for barges by barge type (dry covered, dry open and tank barges). The IRRC report puts forth the barge index and commodity index, which analyze the number of barges by type and commodities dating to 1998. The commodity index is prepared for the tons moved and the ton-miles.
A pressure index is then calculated for each barge type by taking the difference between the barge index and the commodity index (for both the tons and ton-miles). Conceivably, if a barge pressure index is rising, that means the barge fleet is facing more pressure, while a falling index means the fleet is under less pressure. The barge fleet could be pressured by increased demand or too few barges in the fleet relative to the demand, or a combination of both. Conversely, a weakened pressure index reflects softer demand for barge service or too many barges relative to the demand for service, or a combination of both.
Keep The Fleet In Balance
The indices are prepared using a supply and demand table for each barge type. The supply represents the number of barges in operation at the end of each calendar year, as compiled through WJ’s survey of barge operators, conducted by Polaris Analytics and Consulting. The demand side of the equation is the volume of commodities moved by barge type. Each commodity was assigned to a barge type based on its characteristics and industry insights. Taken together, the supply and demand become the balance tables for the respective barge types.

The supply and demand table above (Figure 1) represents the dry covered fleet, and the commodities moved. The barge fleet is current through 2023, while the volumes data is through 2022 (with estimates for 2023). Similar tables are available on a ton-mile basis. The tonnage, barge and pressure indices are on the table as well.
The size of the barge fleets and commodities moved for 2024 are forecasts by Polaris. The barge fleet forecast considers the size of fleet required less retirements plus new builds.
Pressuring The Fleet
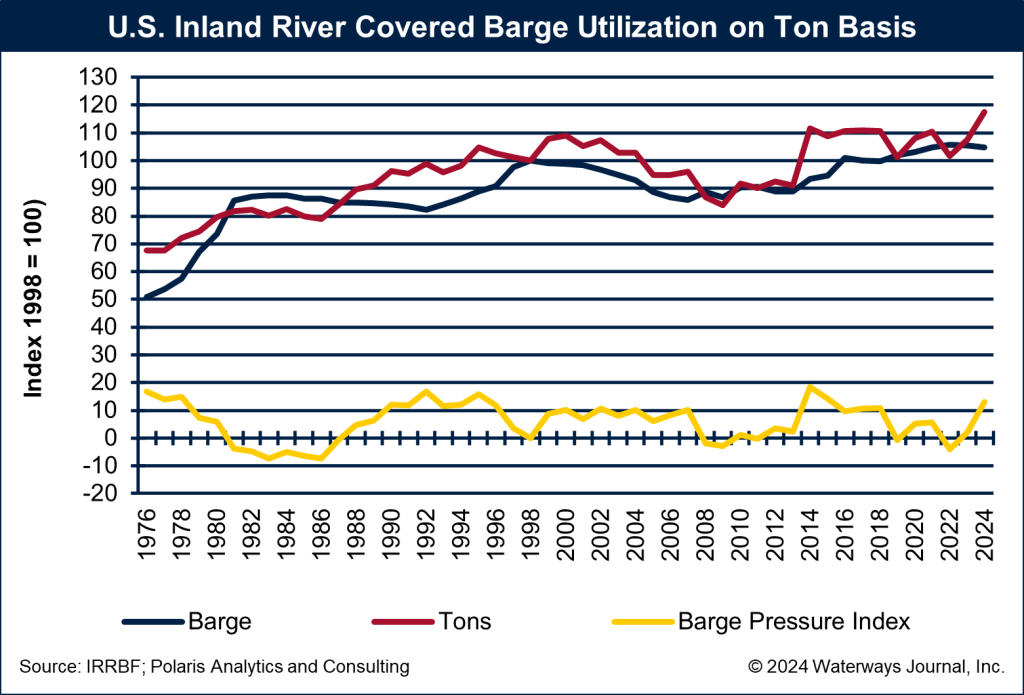
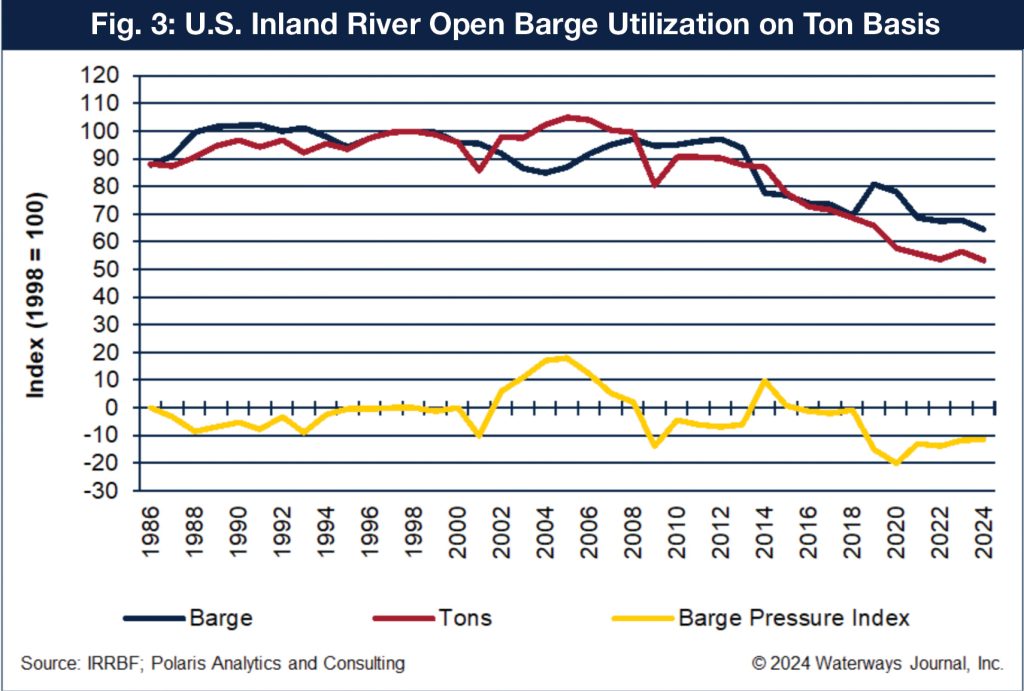
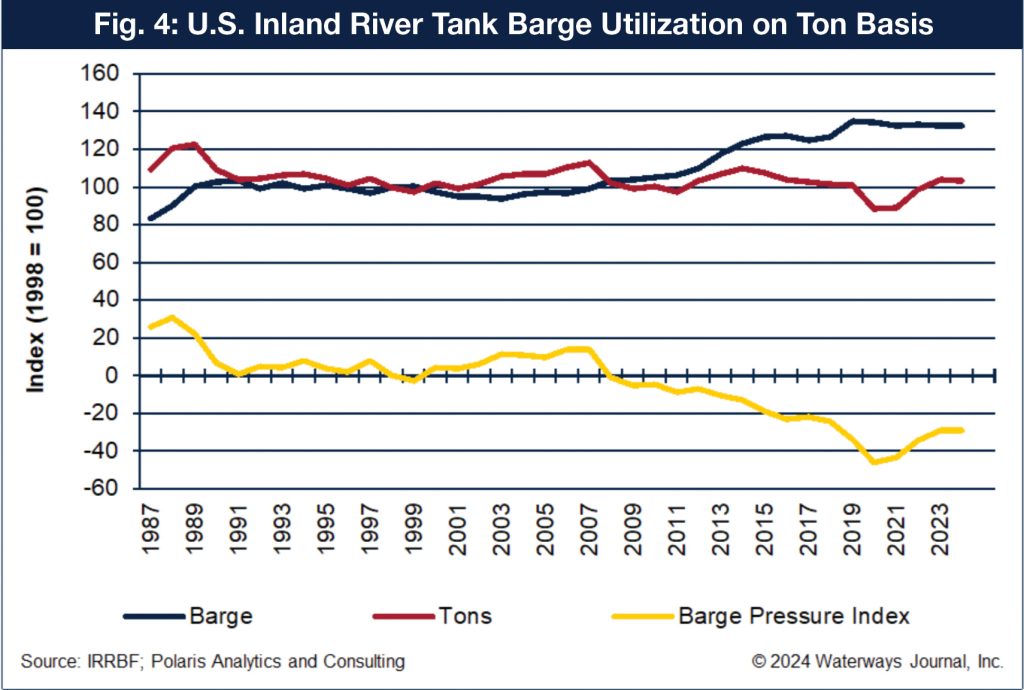
It is not so much the absolute level of the barge pressure index that matters as much as the direction the pressure index is moving. The following graphs (Figures 2, 3 and 4, below) reflect the indices.
The covered barge fleet is expected to be under increased pressure from 2023 through 2024. With a fleet that is expected to shrink and tonnage that is a bit firmer, the pressure index will increase.
The pressure on the open barge fleet through 2024 is expected to be subdued as the fleet will shrink more than the demand for service. The fleet has shrunk due to retirements associated with the dramatic drop in demand for coal. Despite the demise of coal, the ton-miles for coal have been steady thanks to the longer-haul movements for export.
Assessing a pressure index for the tank fleet is more problematic. There are four major types of tank barges, each with their unique service characteristics. Despite that, the overall index is presented, reflecting a pressure index that rebounded strongly out of COVID on tonnage growth. The pressure index is now stable with a flat to slightly smaller fleet.
“The pressure. Pressure. One, two, three, four, pressure!”
Getting your pressure indices is as easy as one, two, three by reaching out to evan@wjinc.net to receive your copy today!
The forthcoming IRR Fact Book, available from The Waterways Journal later this year, will offer a five-year outlook on the balance tables, including discussion on the drivers of commodity demand, the towboat situation and other insights on the inland rivers. In the meantime, the Inland River Record Commodities report will be a good resource for understanding the historical patterns of commodity movements by barge type and the pressure on each barge type.


