By Ken Eriksen
There is a saying that “cargo is king.” It is obvious, but a continual reminder is nice: without cargo there is no need for barges, and without barges, cargo would not flow. While cargo may be king, barges make cargo royalty.
The fleet of barges operating on the inland river system was built with purpose and profit motives to move volumes of well-priced cargo from their origin to a destination. Barges handle many types of cargo. However not all cargo uses the same barge, and not all barges can carry every cargo. It is one thing to know the number of barges afloat and in revenue service, but it is another thing to understand why barges are in service.
The last Horizons column (U.S. Inland Barge Fleet Aging Despite Getting Bigger, June 14) explored the results of the Inland River Record (IRR) Barge Fleet Profile, noting that the fleet expanded 1 percent to 22,356 barges as of Dec. 31, 2023. This column builds upon that and looks at the cargo being hauled, the volume and ton-miles and average distance moved, by barge type—dry cover, dry open and tank.
Diverse Commodity Mix
The type of commodities moved by barge total more than 140 at the four-digit commodity code level (e.g., coal, gasoline, corn, soybeans, etc.). The commodities moved are the building blocks of the U.S and global economies. These are the ingredients to feed, fuel and provide fiber for the global marketplace.
Commodity data of the U.S. waterways is compiled through the Army Corps of Engineers Waterborne Commerce of the United States. The historical tons data is available through 2022 and ton-miles through 2021.
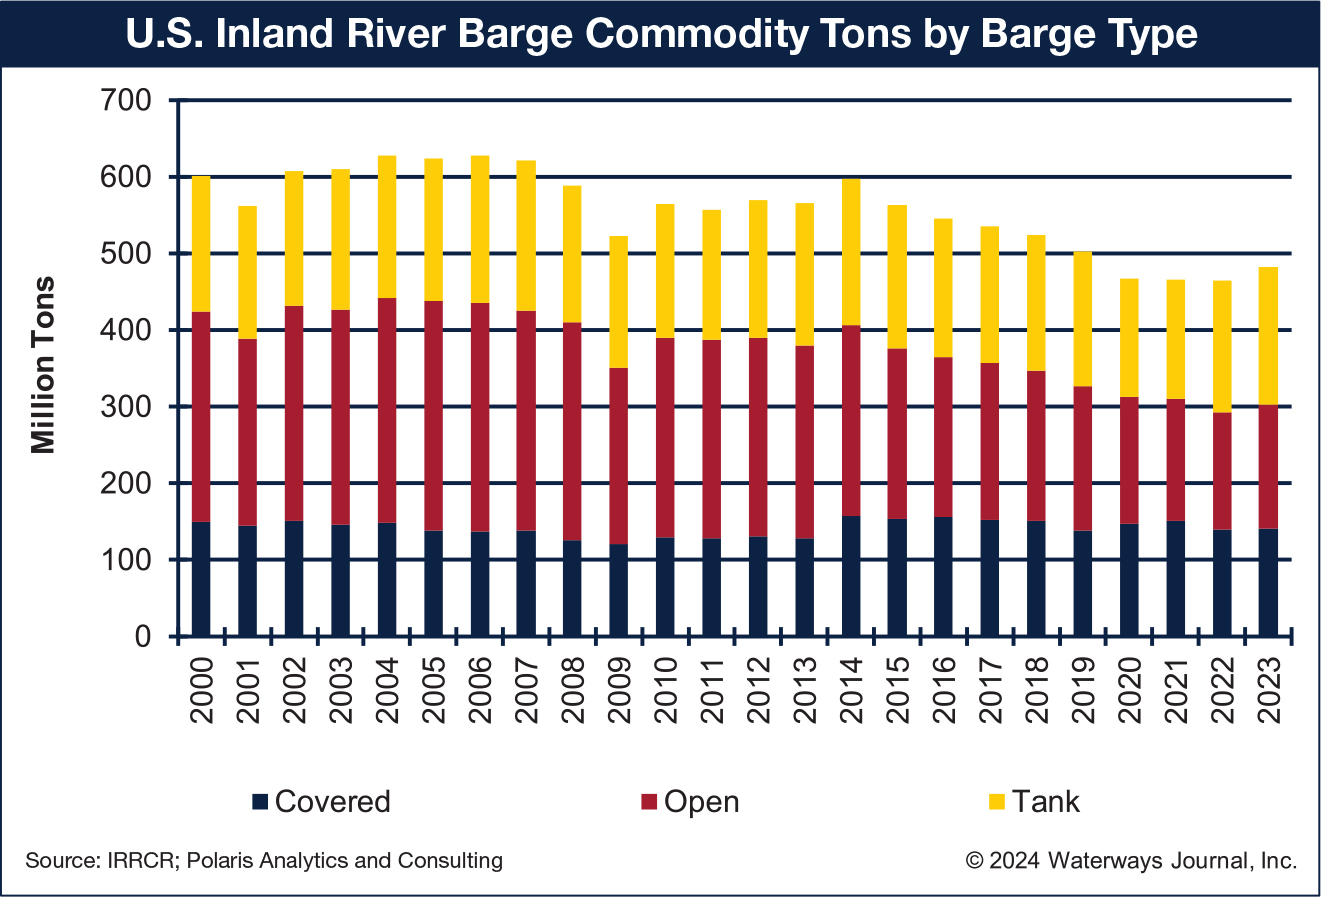
Commodity volumes moved on the inland waterways during 2022 totaled 464.2 million tons, a decrease of 1.4 million tons or 0.3 percent from 2021. Covered barges hauled 139.5 million tons in 2022, open barges 153.7 million and tank 171.1 million as shown in the accompanying chart.
Low water affected navigation and trade flows for two consecutive years, 2022 and 2023. Low water limits barge draft capability with fewer tons loaded, the number of barges in a tow, the speed that tows move, the hours of operation during the day, etc. The net impact was higher costs moving commodities by barge, making those cargoes less competitive with other trade routes within the U.S. and other countries.
U.S. grain exports were record large through crop year 2020-21 (September through August) but fell to a decade low during the 2022-23 crop year. Grain exports improved during 2023-24, but not by much. The Center Gulf export shares were lower on account of the low water of the Mississippi River.
Coal movements have languished with production that nearly totaled 1.2 billion short tons in 2008, falling to less than half that total to about 600 million in 2023. The drop in production is in alignment with coal plants being shuttered and natural gas becoming a competitive energy source. Exports have been a bright spot, holding onto 100 million short tons in 2023 after climbing out of the COVID-19 pull back.
Liquid tank volumes moved by barge were hardest hit during COVID-19 and have steadily regained lost ground, but they still require more time to achieve pre-COVID-19 levels.
Ton-Miles On Inland Rivers
Commodity ton-miles (moving one ton of cargo one mile) during 2021 (the last year data is available) totaled 242.1 billion ton-miles, up 2.2 percent from 2020. Covered barge ton-miles totaled 129.9 billion ton-miles, open hauled 60.9 billion and tank 51.3 billion.
Coal ton-miles regained ground, expanding 22.1 percent from the historic low in 2020 to 25.7 billion ton-miles. Petroleum and petroleum product ton-miles rebounded 10 percent in 2021 to 33.6 billion –ton-miles. Food and farm products ton-miles during 2021 totaled 92.4 billion ton-miles and were essentially unchanged from 2020. Farm products are the highest share of ton-miles moved by barge on the inland river system.
Barge commodity ton-miles are shown in the following chart. Ton-miles for 2022 and 2023 are estimates compiled by Polaris Analytics and Consulting.
Moving Commodities
The average distance commodities traveled during 2021 (the last year that ton-mile data is available) increased to 520 miles. That was 30 miles above the five-year average.
Among the longer-hauled commodities, food and farm products traveled 945 miles by barge in 2021, down 42 miles from 2020.
Despite the drop in coal volumes moved by barge, the distance moved improved, averaging 413 miles during 2021, up nearly 100 miles from 2020.
The average distance crude petroleum moved in 2021 was a record 351 miles. The distance that chemical products move is steady, averaging 677 miles in 2021, which is 8 miles longer than the five-year average of 669 miles through 2020.
While open and tank barges each haul more commodity tons than covered barge, covered barge has more ton-miles than open and tank barge combined. Understanding the commodity mix, volumes, ton-miles and distance hauled by barges is important to know what pressures each fleet of barges endures. The barge pressure will be discussed in a later Horizons column.
Barge Commodities History
The IRR Commodities Report is a companion report to the IRR Barge Fleet Profile report. Versions of each had been produced by Informa Economics and later IHS Markit. In 2022, IHS Markit discontinued the Barge Fleet Profile and Barge Commodity reports. The Waterways Journal acquired the barge survey and data from each report, publishing its survey in 2022 and 2023. The commodities report was not published during those two years.
The IRR Commodities Report summarizes movements of commodities and products on the inland river system by barge type while using barge pressure indices to assess the supply of barges compared to the demand for barges. The U.S. inland river system includes the navigable areas of the Upper and Lower Mississippi River and Ohio River systems and the Gulf Intracoastal Waterway.
Polaris Analytics and Consulting prepared and compiled this year’s IRR Commodities Report. The full reports are available for purchase.
Interested parties can inquire via evan@wjinc.net.


