The fleet of barges plying the inland rivers and waterways of the Mississippi River and Gulf Intracoastal Canal are aging, and that process is not likely to slow down anytime soon.
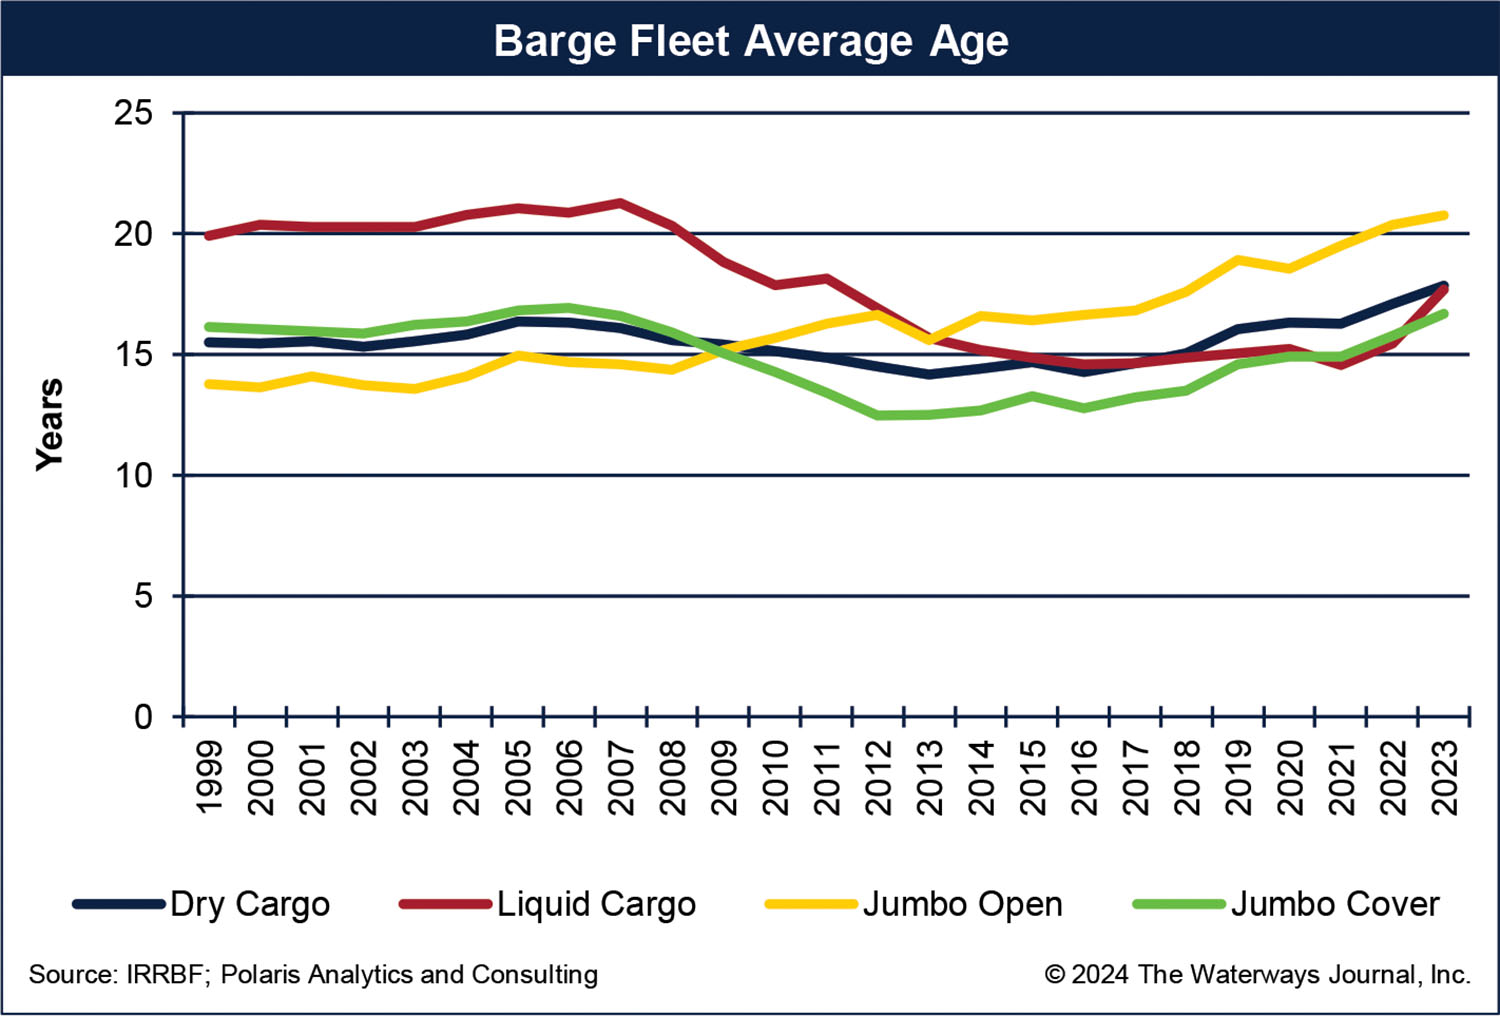
There are two main types of barges used to move commercial traffic on the inland waterways: dry hopper barges and liquid tank barges. Open and covered barges are dry barges. The average age of the open barge fleet hovered below 15 years of age from the late 1990s until 2009. Starting in 2009, the open fleet, which is primarily used to haul coal, soil, sand, rock and stone, slowly started to age to about 17 years old in 2017. Then it accelerated in age to nearly 21 years during 2023. Liquid tank barges were older early on, above 20 years on average from the late 1990s to 2008, dropping to 15 years by 2021. Since 2021, the age of the tank fleet has turned higher, averaging 18 years during 2023. The covered fleet hovers on either side of 15 years old and since 2021 has been getting older, averaging about 17 years in 2023.
The average age of the U.S. inland barge fleet by barge type is shown in the chart below.
Barge Fleet Survey
The Waterways Journal is about to release the complete results of the 2024 survey. The survey strives to identify the line haul, commodity-carrying fleet of inland barges operating on the inland rivers by barge operator. The key data gathered is the number of barges in revenue service at the end of the calendar year by barge type and by year of construction. Other questions asked of the operators include the number of barges retired during the year, what is the value of a vintage aged, covered barge and the average number of trips per year, among others.
The age of a barge is reflective of the condition of the fleet. For example, if the fleet is getting younger, that means newer barges are entering service, older barges are being retired at an accelerated pace or a combination of both.
Barge Fleet Size Varies By Type, Impacting Age
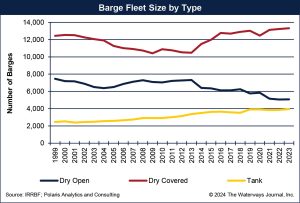
The fleet of barges increased 1 percent during 2023 to 22,356 barges, which is static since 2016. Based on the responses of the operators and industry data, there are differences by equipment type, however. The size of the barge fleet by equipment type is shown in the accompanying chart.
The tank fleet has increased steadily, nearly doubling from about 2,000 barges in 2000 to about 4,000 in 2019 through 2023. As the tank fleet size has stagnated, though, its average age has not, signaling that operators are holding on to older equipment for longer periods without replacement.
The size of the dry fleet is moving in opposite directions. The number of dry open barges in operation has shrunk 31 percent since its recent peak of 7,325 in 2013, dropping to 5,088 in 2023. The open fleet has fallen with the drop in domestic coal production (down more than one-half from its peak of 1.2 billion short tons in 2008) and subsequent usage in the United States due to energy transition and carbon sequestration efforts. One upside for open barges is strong coal exports, which have doubled over the past 20 years to more than 100 million short tons.
As much as the dry open fleet has shrunk, the dry covered fleet has expanded. At the end of 2023, the covered fleet totaled 13,321 barges, an increase of nearly 1 percent from 2022, and a record fleet size. Nearly 16 percent of the covered fleet was built prior to 1998, and that portion of the fleet is quickly aging without new equipment being added to offset the aging effect. The covered fleet, which is mostly used to haul farm and grain commodities and other weather-sensitive products, bottomed out in size between 2010 and 2012. Since 2013, the industry added more than 2,900 covered barges to the fleet.

Better With Age, Given Limited Fleet Expansion Capability
The reality is the respective barge fleets will not expand rapidly anytime soon. There are a handful of shipyards that build barges, with one larger operator, a steady builder, and a few that specifically build tank barges. Otherwise, a lack of shipyard capacity is a governor on how fast equipment can be added to the fleet. Not only that, but the shipyards also have challenges attracting skilled labor, while experiencing higher steel costs to build equipment. Both issues are exacerbating the difficulties of building new equipment.
Let the survey respondents be an indicator of the cost of equipment. They reported the value of a 10-year-old covered barge averaged a record $613,000 in 2023. If a used 10-year-old barge is record high, then a new barge is higher still.
Retaining older equipment then becomes an insurance to have equipment to deploy. Shippers, like it or not, will have to be accustomed to older equipment.
Brief Barge Fleet Survey History
The barge fleet profile survey, first launched in 1988 by Jack Lambert at Leeper, Cambridge & Campbell Inc., together with Gerry Brown of Cargo Carriers, has been an indispensable management tool for the water transport industry and a valued reference to allied services and suppliers. Lambert sold the survey to Sparks Companies Inc. in 1997, which was bought by Informa plc as Informa Economics in 2003, which in turn was sold to IHS Markit in 2019. IHS Markit discontinued the survey in 2022, which is when The Waterways Journal acquired the survey and data.
Polaris Analytics & Consulting compiled this year’s survey for The Waterways Journal and appreciates the participation of barge operators and industry participants.
The Waterways Journal will make the 2024 report, and the companion barge commodities report, available at the end of June.


